

Data is behind far more of your daily life than you may realize. It helps determine which videos appear in your feed, how retailers manage inventory, how hospitals evaluate treatments, and how colleges understand student needs. DATA 101: Data Analytics introduces you to the methods used to turn large amounts of information into useful evidence and better decisions.
You do not need to be a mathematical genius or an experienced programmer to begin. You need curiosity, patience, and a willingness to ask precise questions. Whether you are choosing your first college course, exploring a potential major, or looking for careers that can help you finance and build your future, this subject gives you a practical foundation. Here is what you will study, what type of student does well in DATA 101: Data Analytics, and how the course may shape your academic and career planning.
What Is DATA 101: Data Analytics?
DATA 101: Data Analytics is an introductory course about using data to understand situations, identify patterns, evaluate claims, and support decisions. In practical terms, you learn how to move from a vague question, such as "Why are sales declining?" or "Which students need additional support?", to a defensible answer based on evidence.
Data analytics is sometimes confused with data science. The fields overlap, but an introductory analytics course generally focuses on collecting, preparing, examining, and presenting data. You may work with spreadsheets, databases, basic statistical methods, and visualization tools. More advanced data science often adds programming, machine learning, and complex mathematical modeling.
The course also emphasizes judgment. A dataset is not automatically objective simply because it contains numbers. You must consider where the information came from, which groups may be missing, how questions were phrased, and whether the evidence truly supports a conclusion. This combination of technical skills and careful reasoning makes data analytics valuable in business, health care, education, government, communications, environmental studies, and many other fields.
The Core Questions Data Analytics Helps Answer
Most analytics projects begin with a question. What happened? Why did it happen? What is likely to happen next? What action should someone take? DATA 101 helps you distinguish among these questions because each requires a different approach.
Descriptive analytics summarizes existing information. For example, you might calculate the average amount of time students spend commuting or compare scholarship applications by month. Diagnostic analytics looks for possible explanations, such as whether commute time differs by location or course schedule. Predictive analytics uses historical patterns to estimate what could happen next, while prescriptive analytics compares possible actions.
You will also learn to challenge misleading interpretations. A correlation between two variables does not necessarily mean one caused the other. If students who use tutoring services earn higher grades, that does not prove tutoring alone produced the improvement: motivation, available time, or prior preparation may also matter. Asking these questions protects you from drawing confident conclusions from incomplete evidence.
Skills and Concepts You’ll Learn in DATA 101
A strong DATA 101 course gives you a repeatable process rather than a collection of disconnected software commands. You learn how to define a problem, locate relevant information, prepare it for analysis, examine results, and explain what those results mean. The skills are useful whether you later study marketing, psychology, nursing, economics, computer science, or public policy.
You may encounter terms such as variables, observations, samples, populations, distributions, averages, percentages, outliers, and statistical significance. You do not need to master every advanced method immediately. The more important early goal is understanding which method fits a question and how confidently you can interpret its results.
Data Collection, Cleaning, and Organization
Before analysis begins, data must be gathered and organized. You might work with a survey, a public dataset, transaction records, experiment results, or information entered into a spreadsheet. Each source presents different concerns. A survey can contain biased questions. Administrative records may use inconsistent categories. A public dataset may omit important details.
Cleaning data means identifying and addressing problems such as duplicate entries, missing values, inconsistent spelling, incorrect formats, and extreme observations. Suppose one record lists a state as "New York," another as "NY," and a third as "N.Y." A computer may treat them as three separate categories unless you standardize them. Dates, currency, and percentages can cause similar trouble.
You will also learn to document your process. Keeping a record of what you changed makes your work easier to check, reproduce, and revise. This habit matters in college research and in professional settings, where another person may need to understand how you reached an answer. It also teaches a broader lesson: careful preparation often matters more than flashy analysis.
Statistical Thinking and Pattern Recognition
Statistical thinking helps you separate meaningful patterns from random variation. You may calculate measures of center, such as the mean and median, and measures of spread, such as range or standard deviation. You may compare groups, examine relationships between variables, or interpret a simple probability.
Context is essential. An average can hide substantial differences within a group, especially when a few unusually high or low values distort the result. A percentage can sound impressive until you learn the size of the underlying sample. If five out of ten people prefer an option, that is 50 percent, but it is not the same level of evidence as 5,000 out of 10,000 people selected through a well-designed process.
You will practice recognizing trends, clusters, gaps, and outliers. You may also discuss sampling, bias, uncertainty, and causation. These concepts help you evaluate news stories, social media claims, advertisements, and research findings. Even if you never become an analyst, statistical literacy can keep you from being persuaded by a graph that looks dramatic but lacks meaningful context.
Data Visualization and Communicating Findings
Analysis is incomplete if nobody can understand the result. Data visualization turns numbers into charts, graphs, maps, or dashboards that make comparisons and patterns easier to see. You may learn when to use a bar chart, line graph, scatterplot, histogram, or other format.
Good visualization is not decoration. It requires accurate scales, clear labels, appropriate categories, readable colors, and a title that tells viewers what they are seeing. A line graph may be useful for showing change over time, while a bar chart may better compare scholarship awards across academic programs. A pie chart with too many slices, by contrast, can make simple information surprisingly difficult to read.
You will also learn to communicate findings in writing and conversation. A useful report usually states the question, describes the data, highlights the main evidence, acknowledges limitations, and explains the practical meaning. You should be able to tell someone what the data shows, what it does not show, and what additional information would improve the decision. That clarity is a career skill, not merely a classroom requirement.
What Type of Student Does Well in DATA 101?
You do not need a specific personality type to succeed in data analytics. Students come from many academic backgrounds, and people who enjoy history, biology, sports, business, art, or social issues can all find meaningful applications for the subject. The common thread is a willingness to investigate questions carefully rather than accept the first explanation that appears.
Helpful Habits, Strengths, and Mindsets
Curiosity is one of the most useful qualities. You may find yourself asking why one group differs from another, whether a pattern continues over time, or what information is missing. Attention to detail also helps because a small error in a formula, filter, or category can change an entire result.
Persistence matters, too. Real datasets are rarely tidy. A file may contain confusing column names, incomplete responses, or results that do not match your first expectation. Strong students do not treat an unexpected result as a personal failure. They investigate it. Sometimes the result reveals a mistake: sometimes it reveals something important.
You should also be comfortable explaining your reasoning. Data work is collaborative, and your audience may not share your technical background. The ability to translate an analysis into plain English can distinguish an effective analyst from someone who merely produces complicated charts. Finally, ethical awareness is essential. You may handle sensitive information involving health, finances, education, or identity. Respect for privacy, fairness, and informed consent belongs in every stage of the work.
Coursework, Projects, and Tools You May Encounter
Your DATA 101 coursework may combine short lessons, guided exercises, quizzes, and project-based assignments. Early work could involve organizing a small dataset and calculating summary statistics. Later, you might investigate a broader question, create visualizations, and present recommendations to a nontechnical audience.
A typical project might ask you to study campus transportation, analyze a community health survey, compare household expenses, or examine patterns in local environmental measurements. You could begin by writing a research question, identifying the relevant variables, and explaining how the data was collected. After cleaning the file, you would analyze it, build charts, and prepare a written or spoken presentation.
The tools depend on the school and instructor. Spreadsheets such as Microsoft Excel or Google Sheets are common because they make formulas, filters, pivot tables, and charts accessible to beginners. You may also use SQL to retrieve information from databases or a visualization platform such as Tableau or Power BI. Some courses introduce Python or R, particularly when students need to automate tasks or work with larger datasets.
Do not assume that learning a particular tool is the entire purpose of the class. Software changes. The underlying habits, defining a question, checking data quality, selecting an appropriate method, and communicating uncertainty, remain useful. If you are comparing colleges, review course descriptions and ask whether assignments use real datasets, whether tutoring is available, and whether the class expects prior programming experience.
Projects can also become evidence of your developing skills. Save a polished chart, a short analysis, or a presentation that demonstrates how you approached a question. With permission and appropriate privacy protections, you may later include selected work in a portfolio. That can help you discuss your abilities in an internship interview or scholarship application without simply claiming that you are "good with data."
How DATA 101 Can Support College and Career Planning
DATA 101 can help you make more informed choices about both your education and your career. If you enjoy finding patterns, explaining evidence, and solving practical problems, you might investigate majors such as statistics, data science, information systems, economics, business analytics, public health, computer science, or social science research. You do not have to choose one of these fields immediately. An introductory course can serve as a low-risk way to test your interest.
The skills also transfer to majors that are not labeled "data." A nursing student may analyze patient outcomes. A communications student may evaluate audience engagement. An education major may study learning results, while an environmental science student may interpret measurements across locations and seasons. Employers increasingly value graduates who can read evidence and make responsible recommendations, even when analytics is only one part of their job.
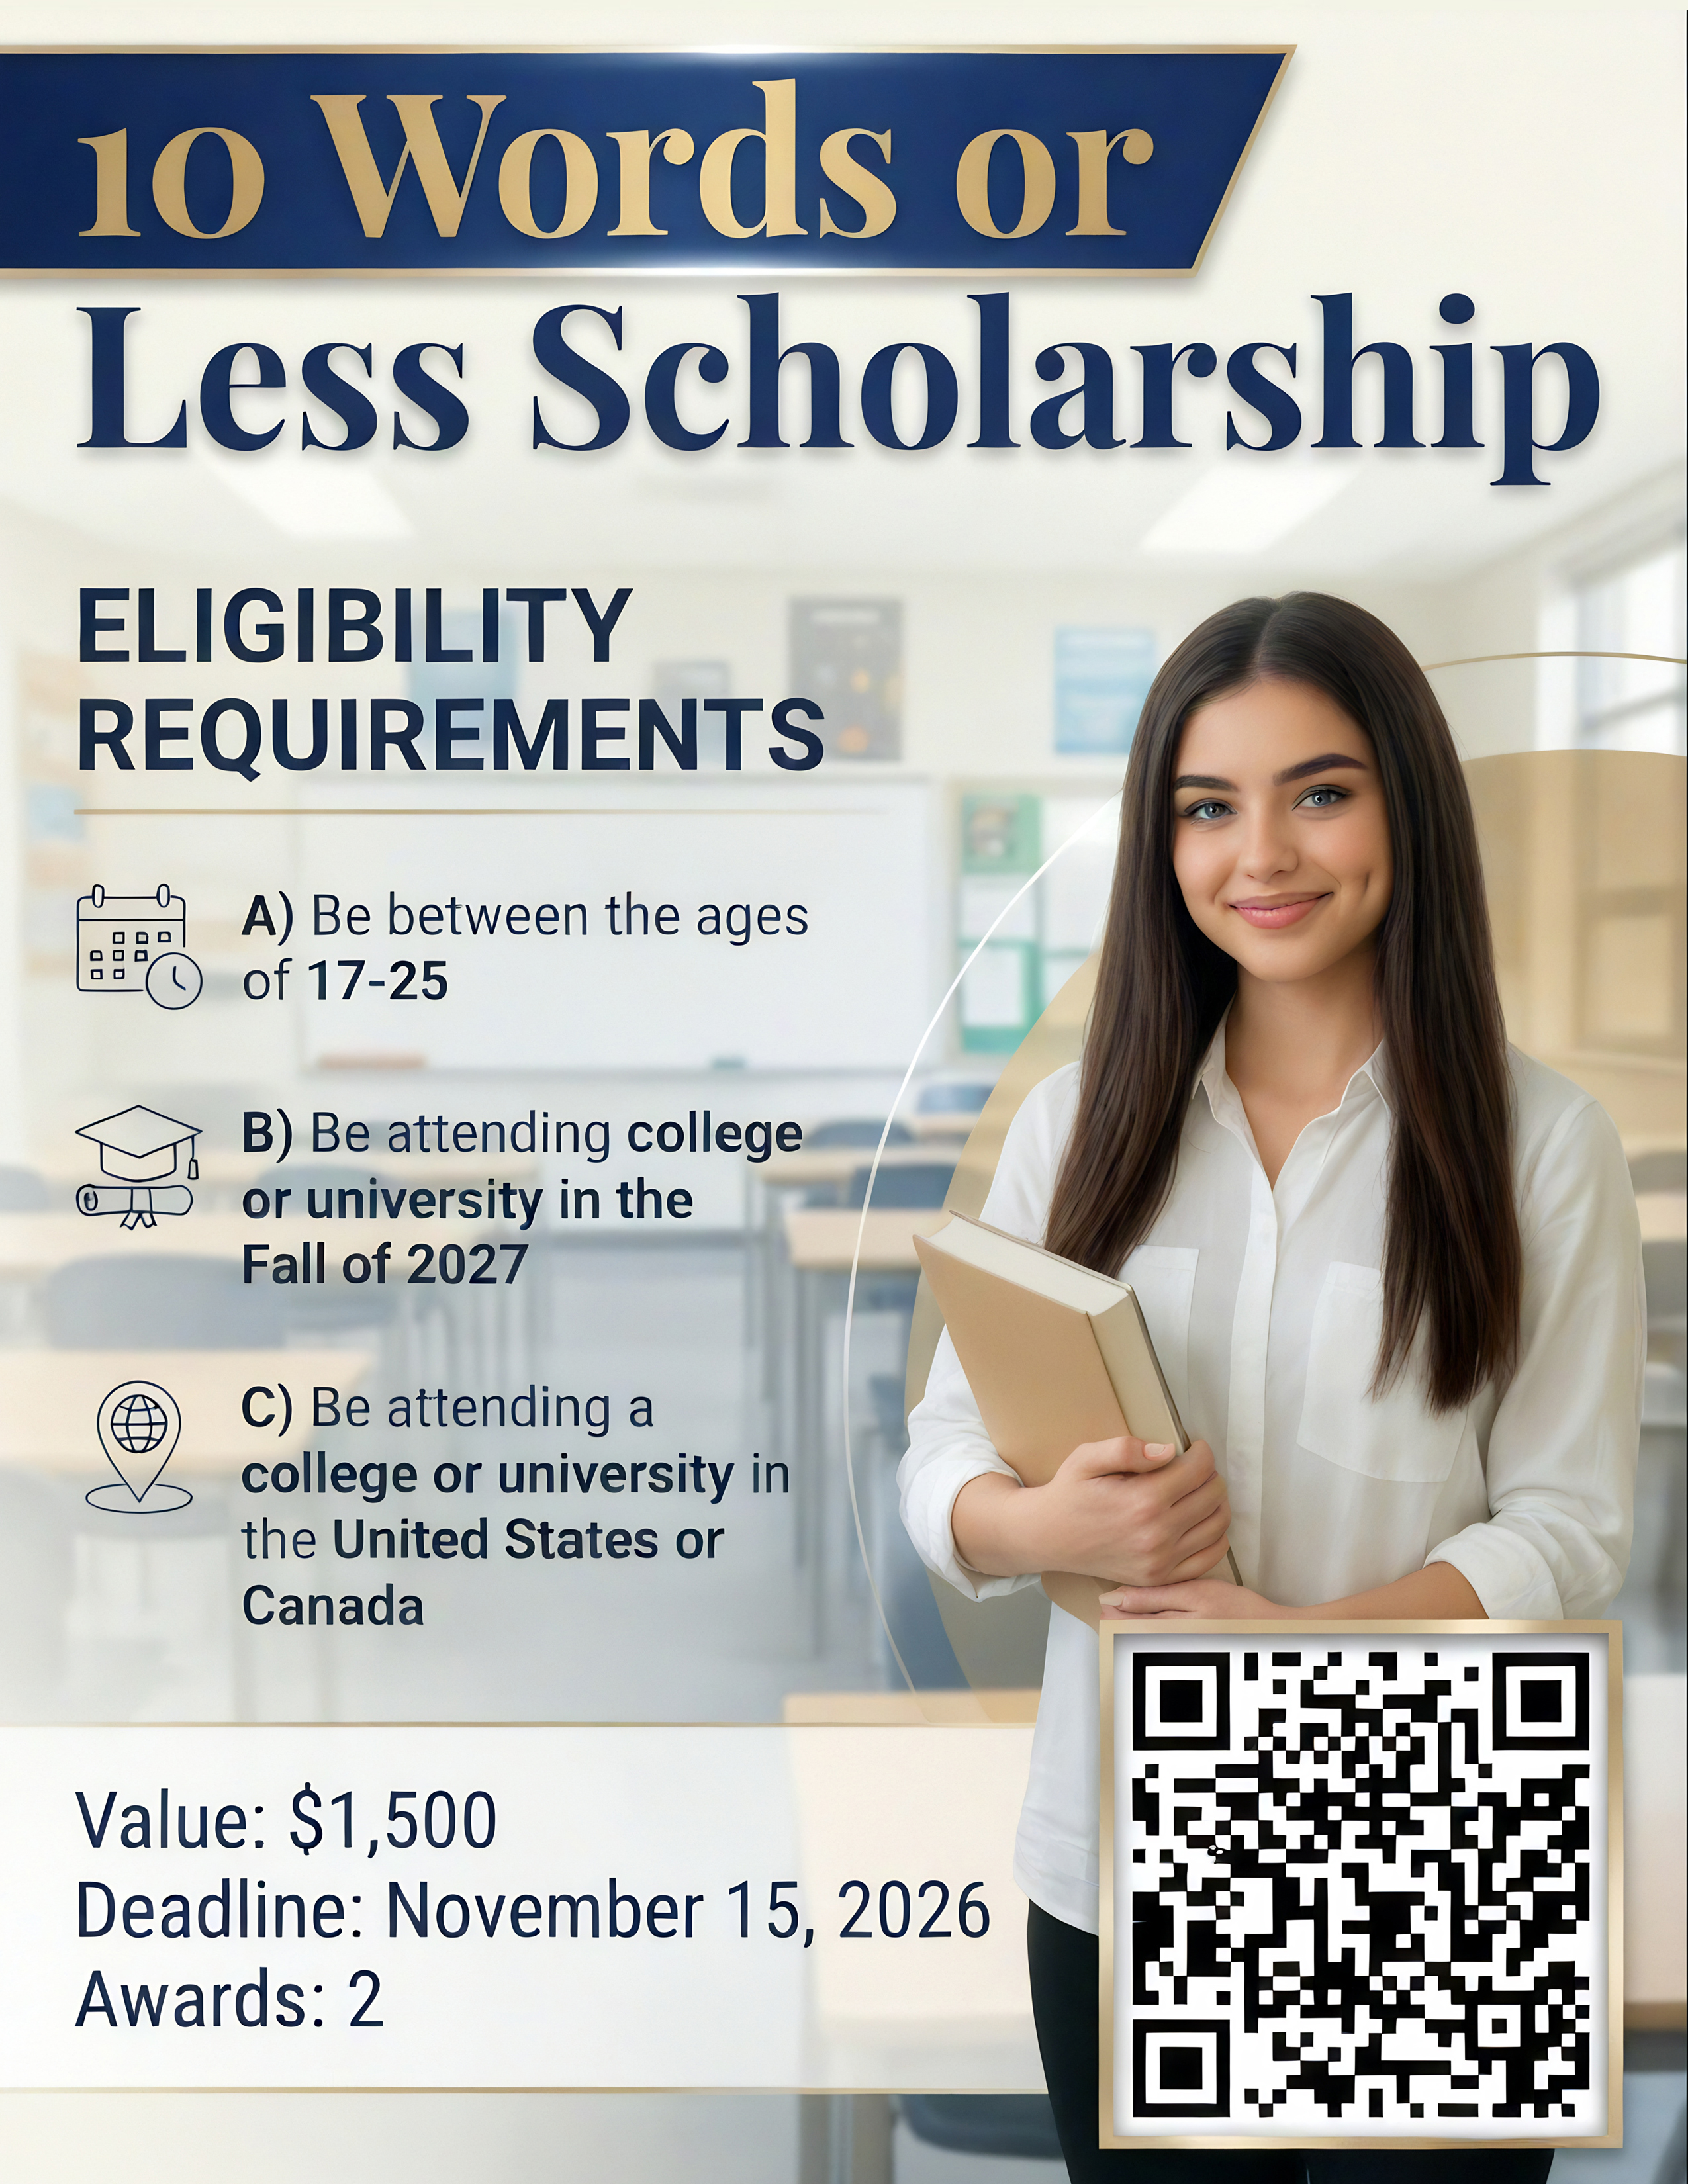
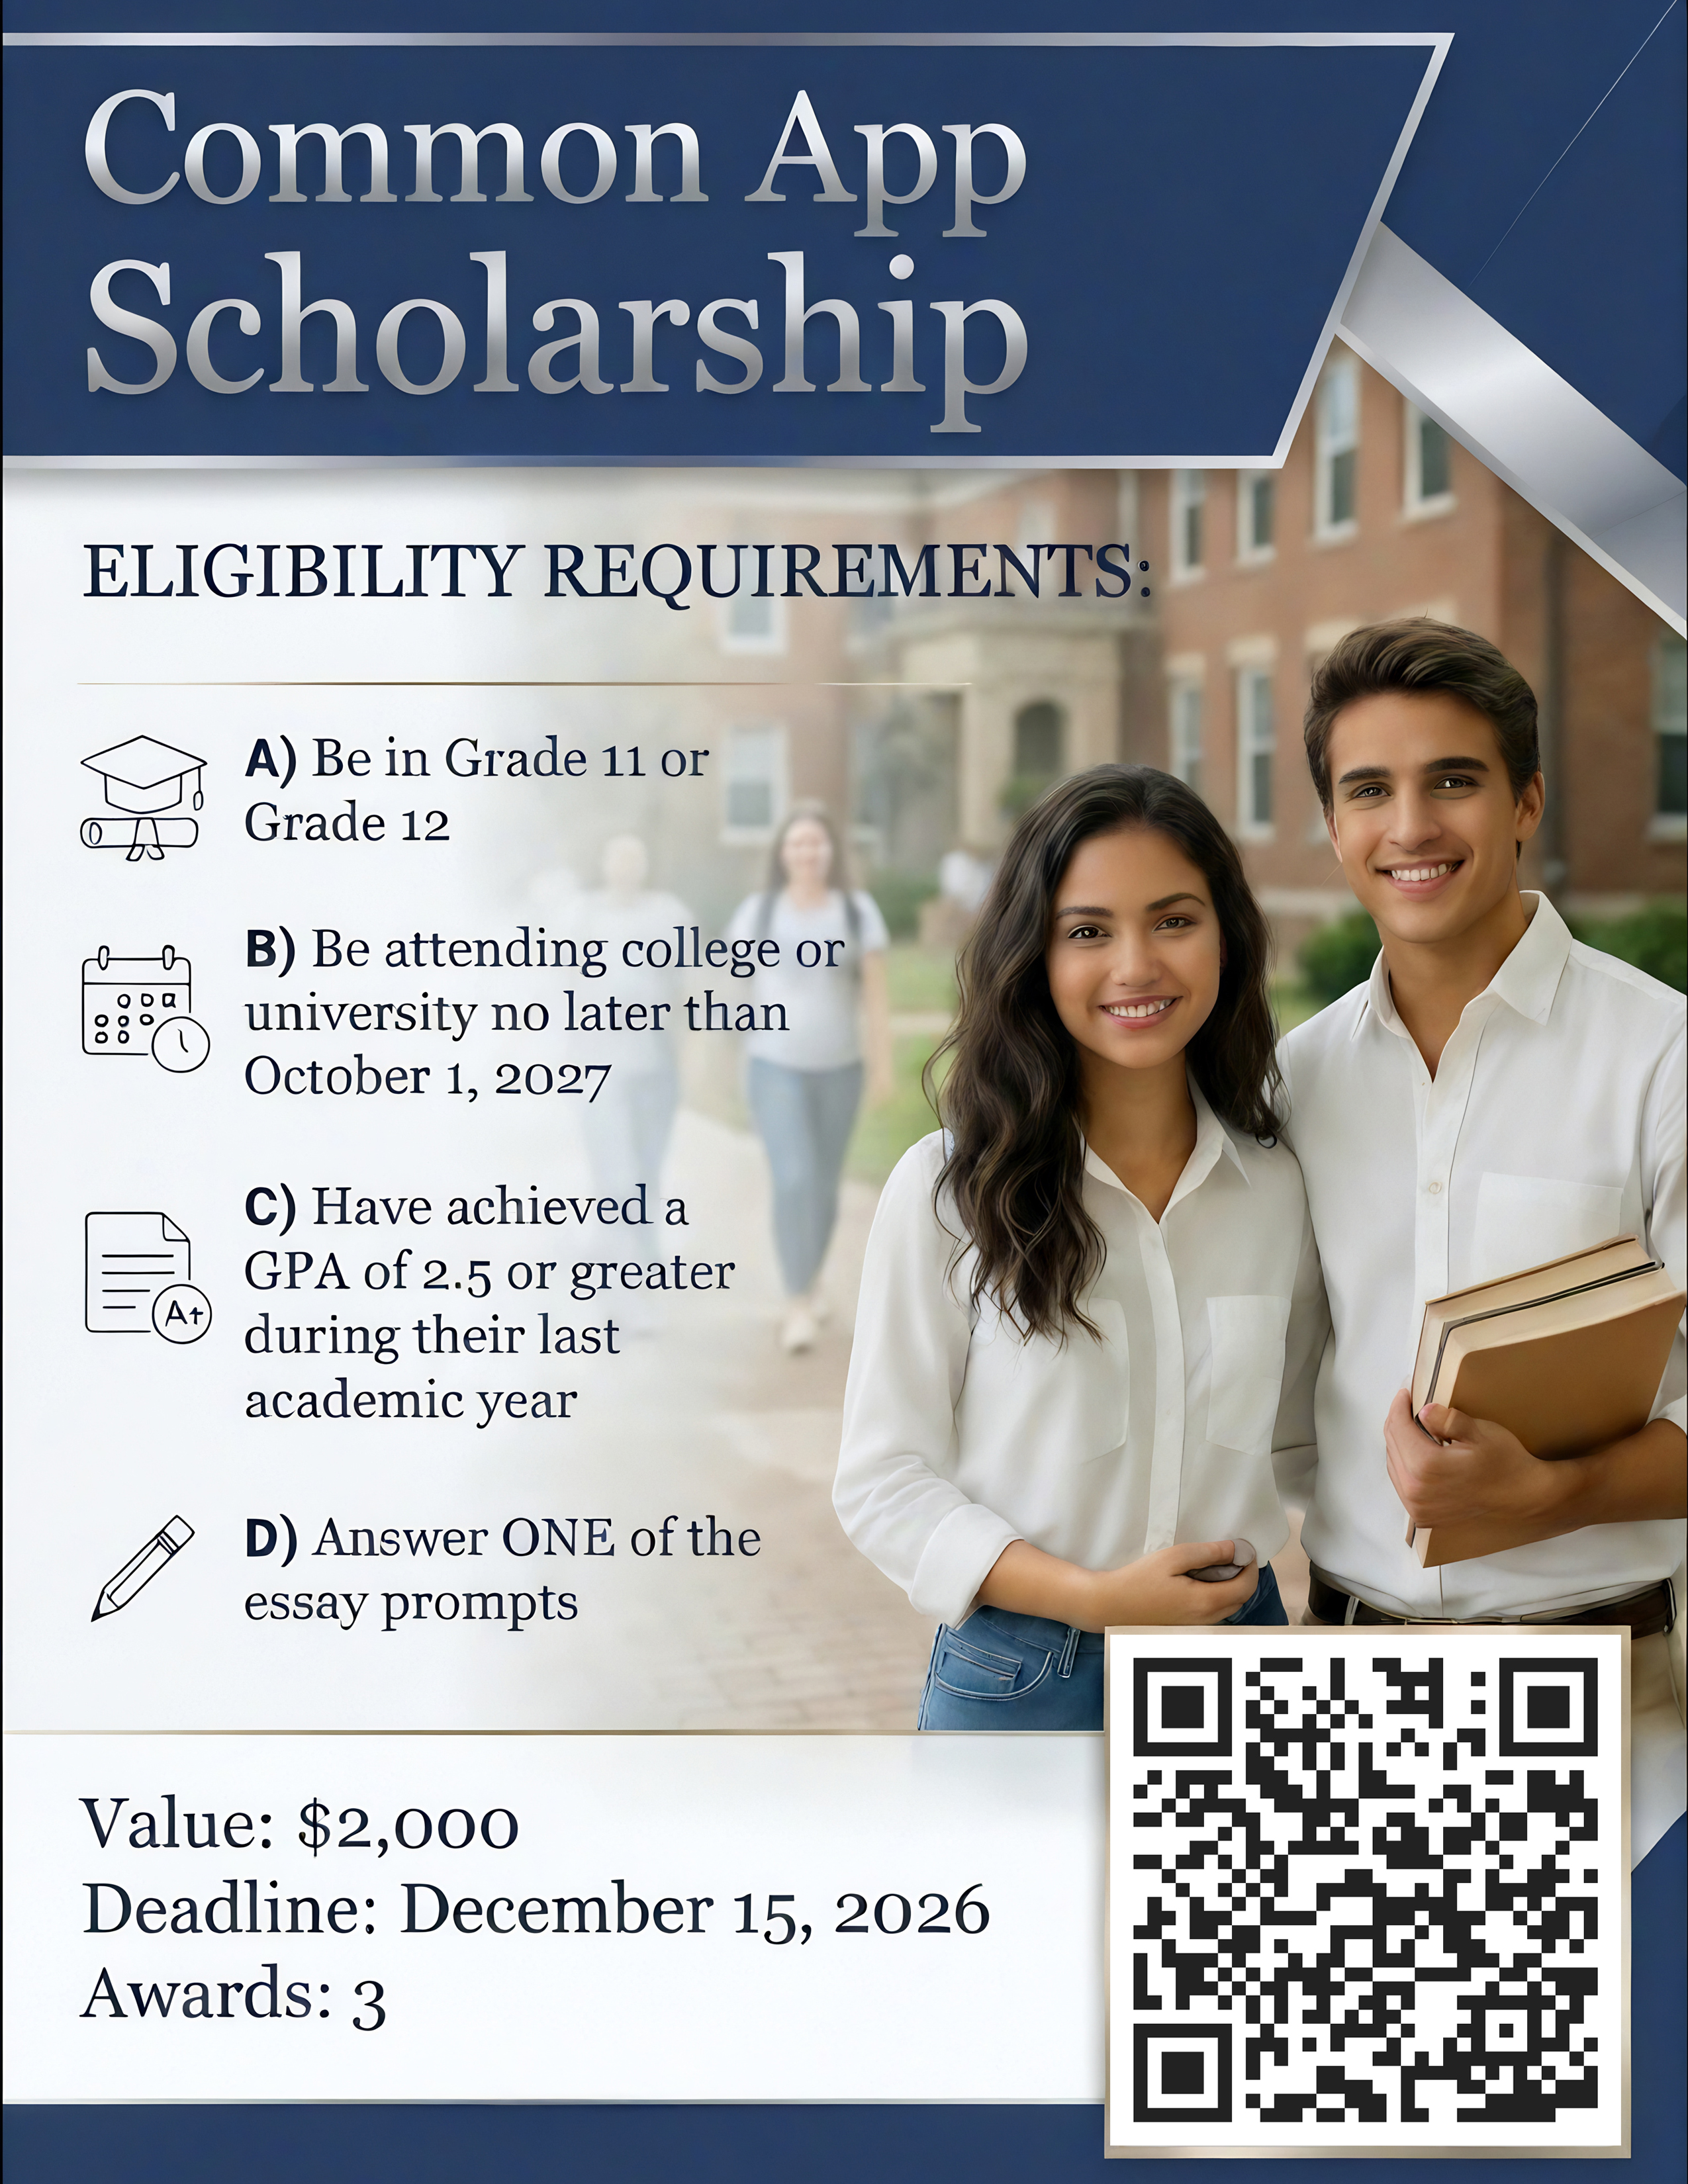
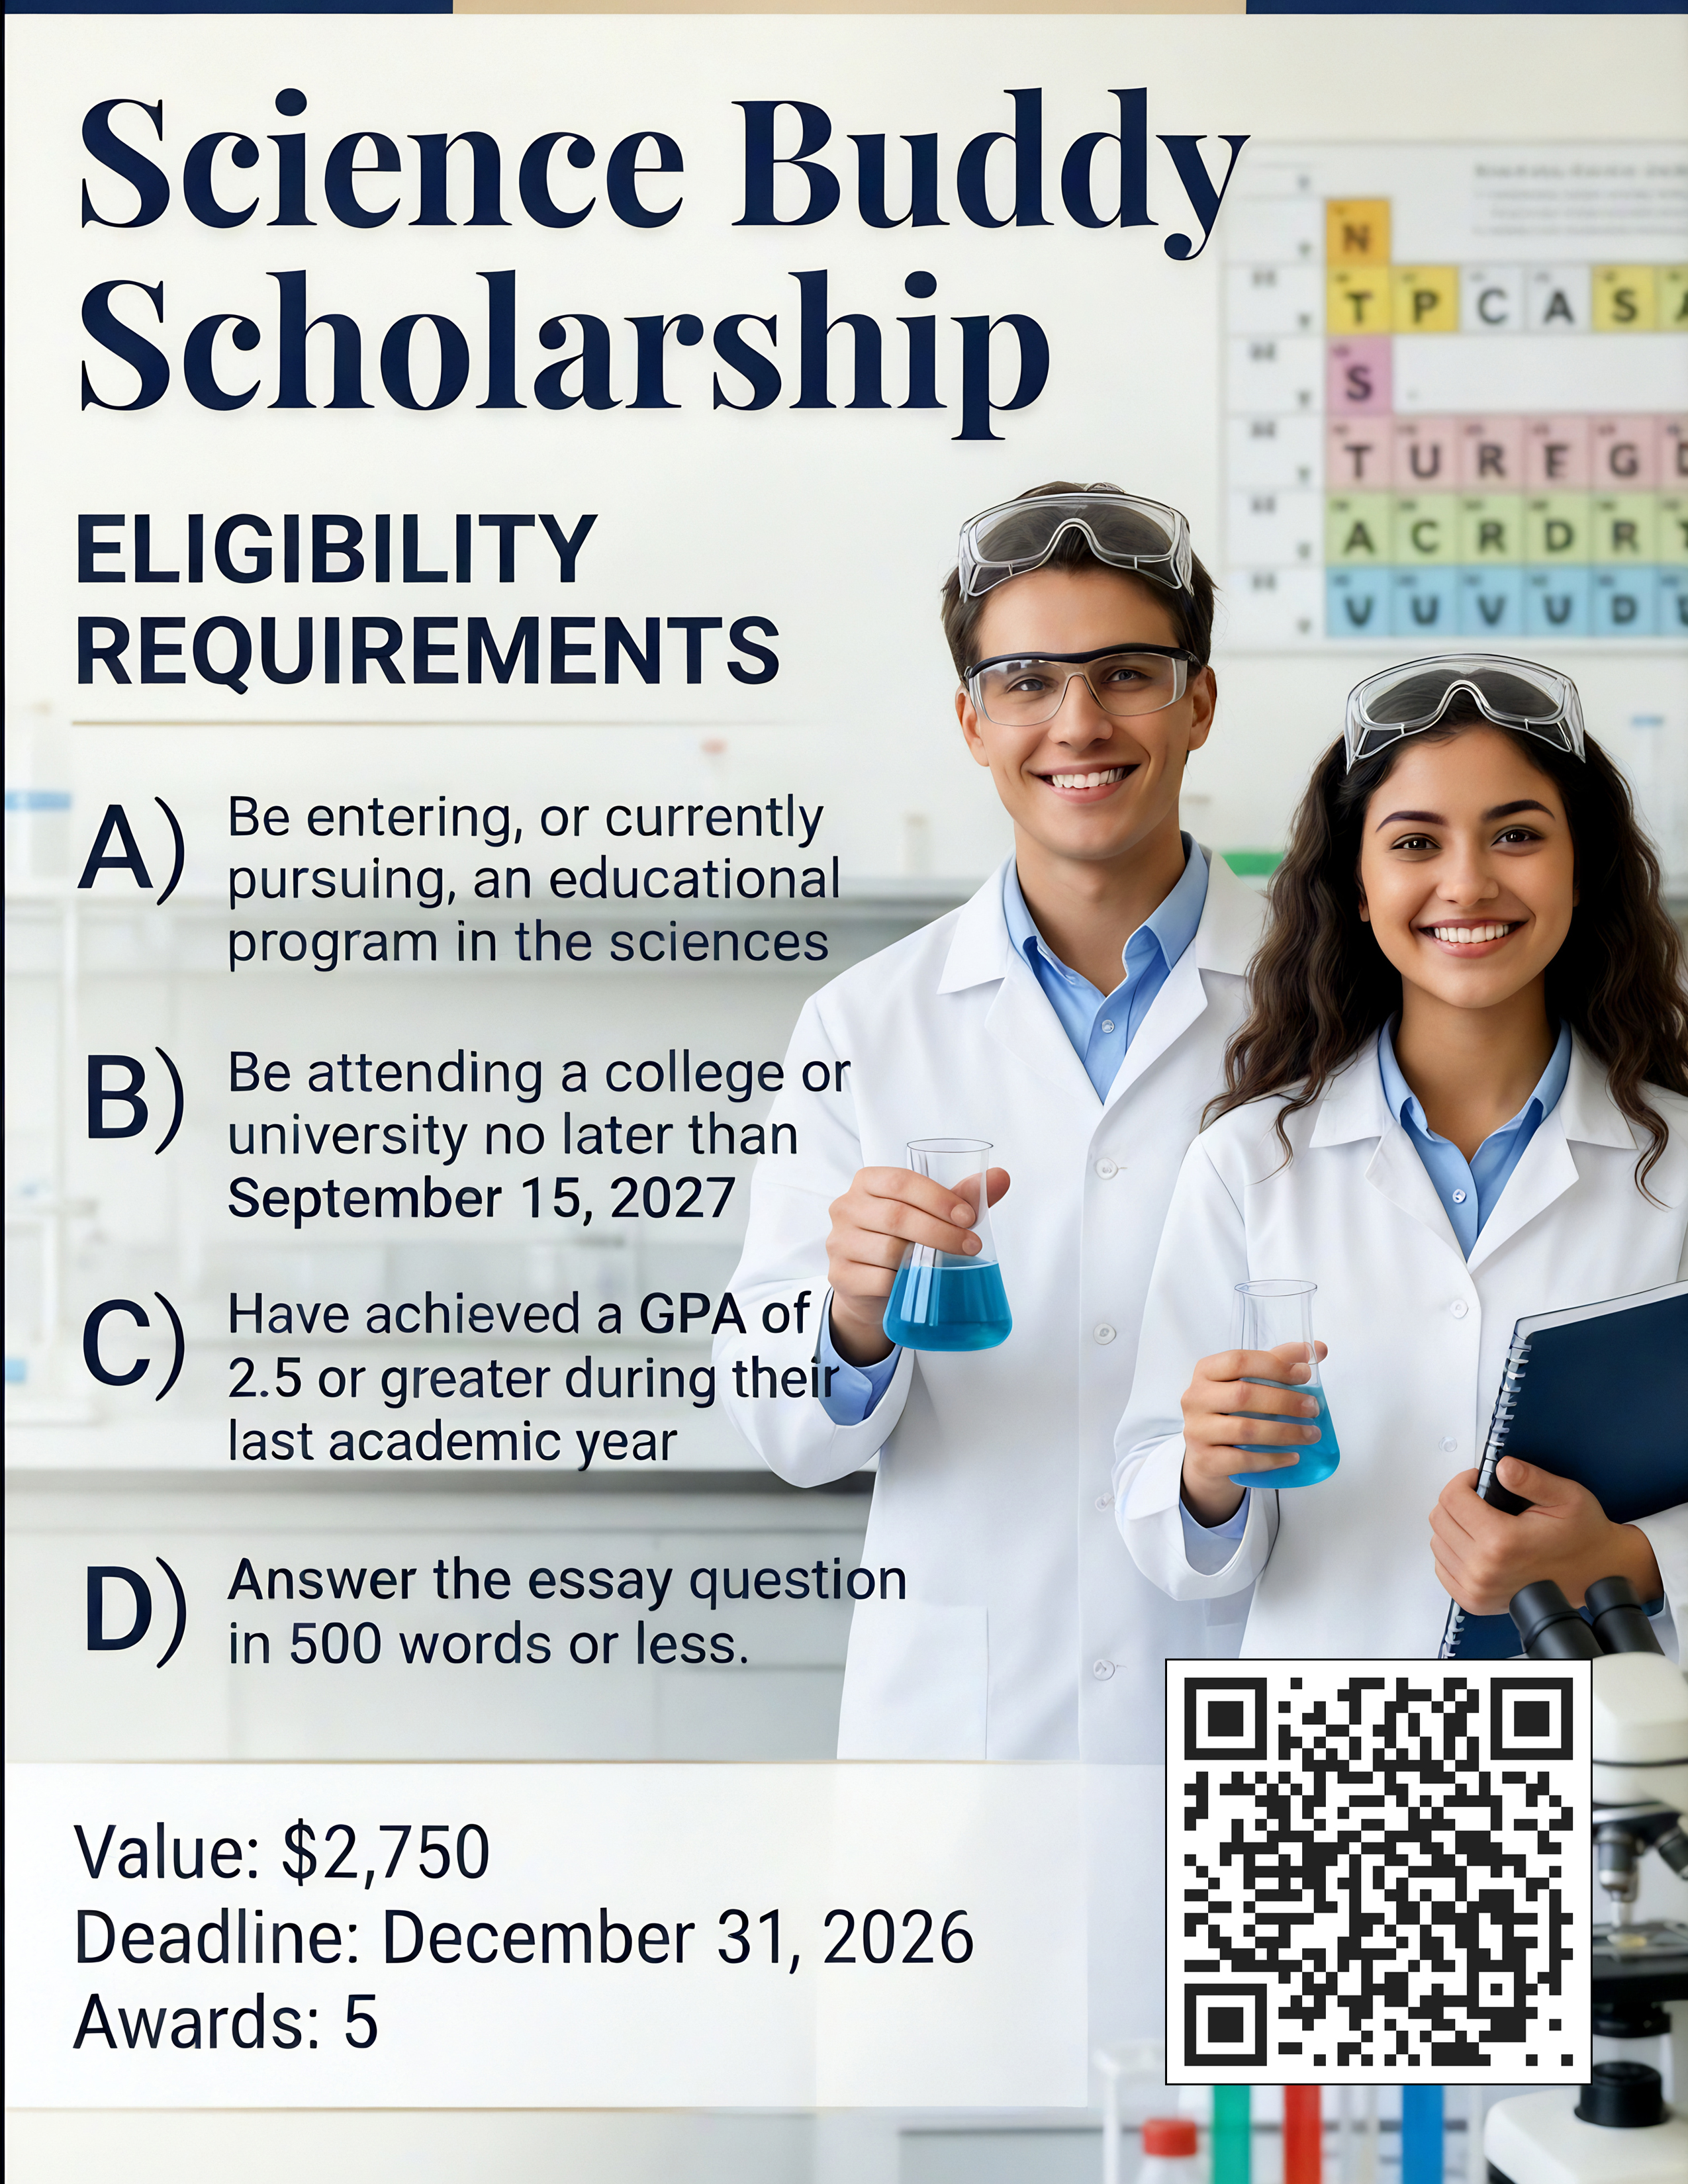
For high school and college students seeking financial aid, data literacy can make the scholarship process more strategic. You can track deadlines, eligibility requirements, recommendation requests, and application outcomes in an organized spreadsheet. You can compare award amounts with renewable conditions, tuition costs, and other forms of aid. A platform such as Studentscholarships.org can help simplify scholarship discovery by matching students with opportunities and providing career guidance: your responsibility is still to verify each requirement and submit accurate information.
Use the same analytical mindset when evaluating programs. Compare graduation rates, typical costs, available aid, internship opportunities, course requirements, and career outcomes, but look at definitions and time frames before drawing conclusions. A single ranking rarely tells the full story. Ask whether the data applies to students like you and whether the source explains its methods.
Career planning benefits from this discipline as well. Instead of searching only for a job title, examine the tasks you would perform, the education required, the industries hiring, and the skills that appear repeatedly in postings. DATA 101 may not determine your future, but it can give you a clearer way to explore possibilities, test assumptions, and choose your next step with stronger evidence.
Frequently Asked Questions about DATA 101: Data Analytics
What is the main focus of the DATA 101: Data Analytics course?
DATA 101: Data Analytics focuses on using data to understand situations, identify patterns, evaluate claims, and support decisions through collecting, preparing, examining, and presenting data with basic statistical methods and visualization tools.
How does DATA 101 differ from advanced data science courses?
While DATA 101 centers on foundational skills like data collection, cleaning, and basic analysis, advanced data science courses often include programming, machine learning, and complex mathematical modeling beyond the introductory content.
What skills will students develop in DATA 101: Data Analytics?
Students learn problem definition, data collection and cleaning, statistical thinking, pattern recognition, data visualization, and effective communication of findings to support informed decision-making.
What types of questions can data analytics help answer?
Data analytics answers questions like 'What happened?' through descriptive analytics, 'Why did it happen?' with diagnostic analytics, 'What might happen next?' via predictive analytics, and 'What action should be taken?' using prescriptive analytics.
Do you need to be good at math or programming to succeed in DATA 101?
No, success in DATA 101 relies more on curiosity, patience, and clear questioning rather than advanced math or programming skills. The course uses approachable tools like spreadsheets and focuses on reasoning and judgment.
How can DATA 101 skills benefit students in non-analytics majors?
Analytics skills transfer to many fields, helping students analyze outcomes, evaluate data, and make evidence-based decisions in majors like nursing, communications, education, environmental science, and more.