

A course titled STAT 854: Practicum in Time Series Analysis signals something more substantial than another theory-heavy statistics class. You'll work with data collected over time, sales, temperatures, interest rates, disease counts, website traffic, or energy demand, and learn how to identify patterns that support better decisions. The emphasis is practical: not simply knowing the equations, but understanding when a method is appropriate, how reliable its results are, and how to explain them to someone who may not be a statistician.
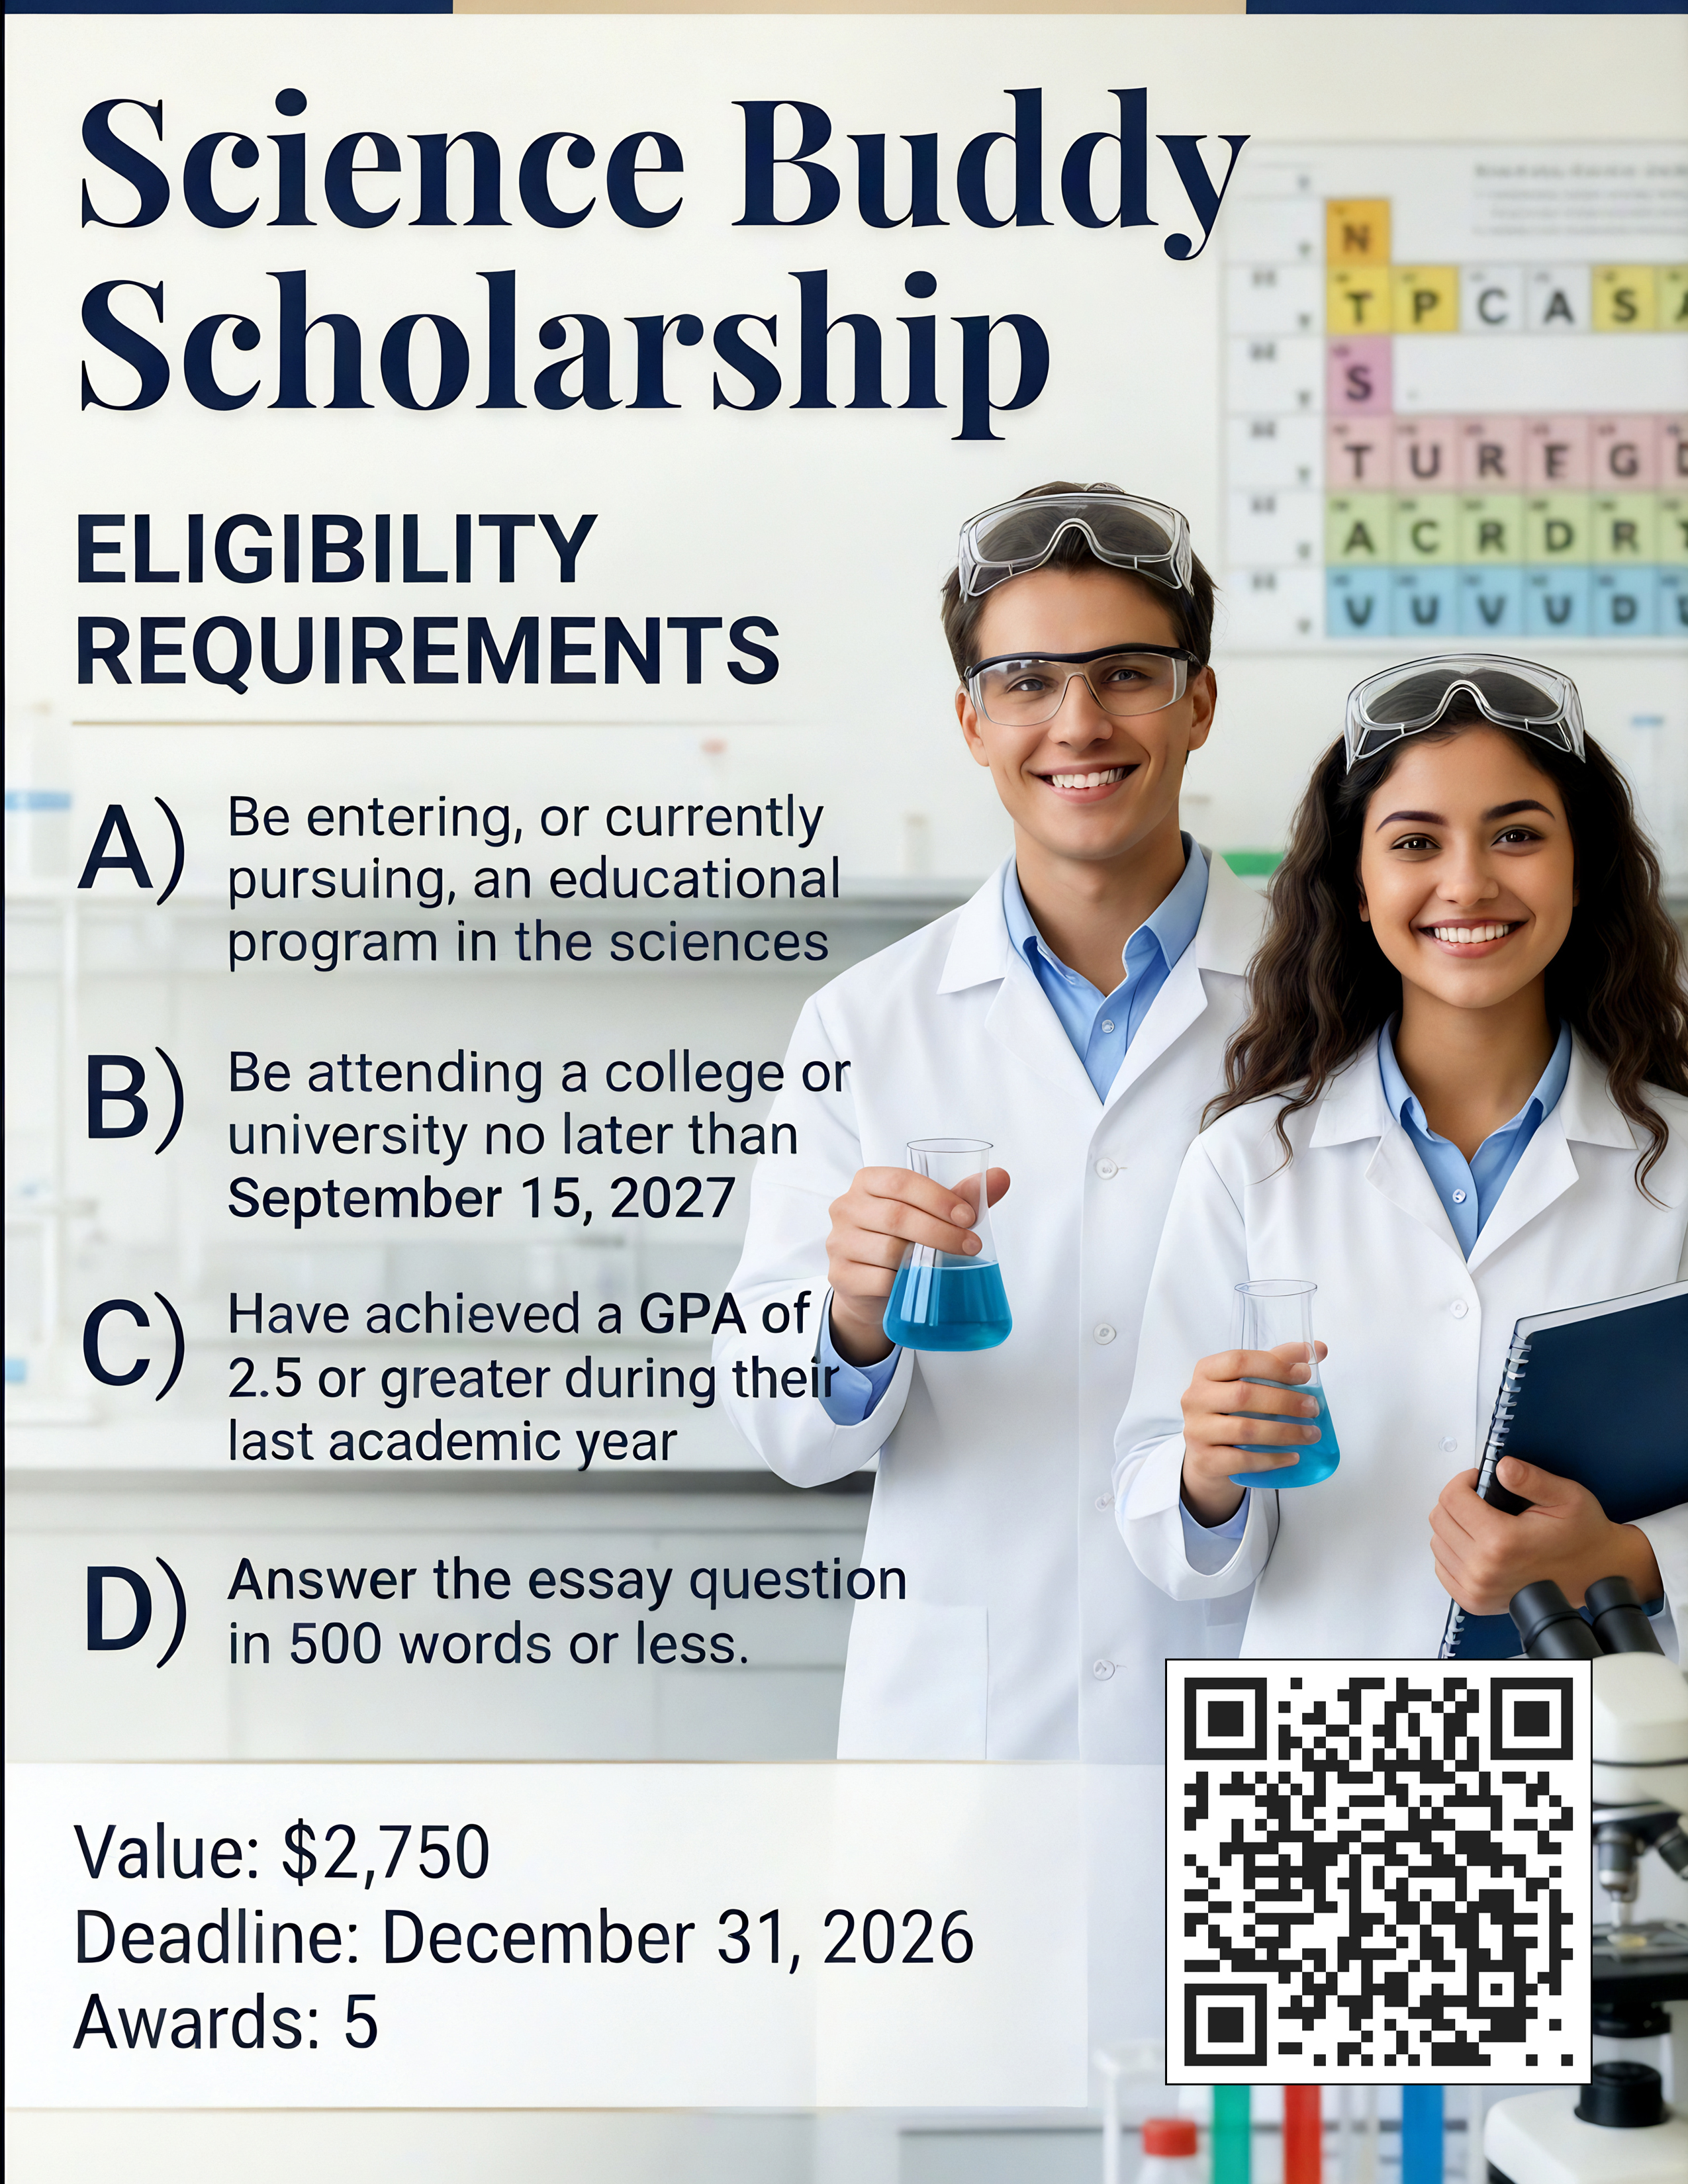
For college students considering statistics, data science, economics, engineering, public health, or business, this kind of practicum can connect classroom learning with real workplace problems. It may also help you evaluate whether advanced quantitative study fits your goals before investing in a graduate program. If cost is part of that decision, scholarship resources such as Studentscholarships.org can help you search for financial aid while you explore potential career paths.
What Is STAT 854: Practicum in Time Series Analysis?
STAT 854: Practicum in Time Series Analysis is best understood as an applied course focused on observations recorded in sequence. Unlike a dataset in which each row may be treated as independent, time series data has an order. Today's stock price may relate to yesterday's price: this month's electricity use may depend on the same month last year: a hospital's patient volume can reflect both recent events and recurring seasonal patterns.
A practicum typically asks you to move through the entire analytical process. You may begin with a messy dataset, define the question, visualize the series, investigate trend and seasonality, select a forecasting approach, test its performance, and present the results. The course may draw on methods such as moving averages, exponential smoothing, autoregressive integrated moving average (ARIMA) models, regression with time-based predictors, or more advanced computational techniques.
The central goal is not to memorize a catalog of models. It is to develop judgment. You need to recognize whether a pattern is meaningful or merely random variation, whether historical behavior is likely to continue, and how much uncertainty belongs around a forecast. Depending on the institution, STAT 854 may be a graduate-level course, an advanced elective, or a specialized practicum. You should review the official syllabus for exact topics, grading policies, and prerequisites.
The Real-World Problems Time Series Analysis Helps Solve
Time series analysis supports decisions whenever timing matters. A retailer can forecast demand before placing inventory orders. A manufacturer can monitor equipment measurements and investigate unusual readings before a breakdown occurs. A city can study traffic patterns, while a utility can estimate how much power customers will need during a heat wave.
The same reasoning appears in finance, public health, environmental science, agriculture, transportation, and technology. A public health analyst might track influenza activity across weeks. An economist could examine employment or inflation data. A marketing team may compare web traffic before and after a campaign. In each case, the question is more specific than "What does the data say?" It becomes "What is likely to happen next, and what should we do about it?"
Time series work also helps distinguish short-term shocks from longer-term movement. A sudden fall in sales might reflect a one-time outage, a recurring holiday effect, or a genuine change in customer behavior. Those explanations lead to different decisions. By learning to separate signal from noise, you become better prepared to make evidence-based recommendations rather than reacting to every fluctuation.
Forecasts are not promises, and a responsible analyst says so. A good analysis reports uncertainty, identifies assumptions, and explains what could make the forecast fail. That combination of technical reasoning and practical caution is valuable in nearly any data-centered field.
What Will I Learn In STAT 854?
The answer to "What will I learn in STAT 854: Practicum in Time Series Analysis?" depends on your school's syllabus, but you can generally expect three connected areas of study: preparing and exploring time-based data, building forecasts, and communicating the evidence behind your conclusions.
Time Series Data Preparation And Visualization
Before choosing a model, you'll learn why data preparation matters. Dates may be stored as text, observations may occur at irregular intervals, and missing values may require careful treatment. You may need to aggregate daily records into weeks, align several series, account for time zones, or identify duplicate measurements. A technically sophisticated model cannot rescue a poorly defined time scale.
Visualization is often your first serious diagnostic tool. Line charts can reveal trend, volatility, breaks, and seasonal repetition. Comparing a series with a rolling average may make its underlying direction easier to see. You might also examine seasonal plots, autocorrelation, lag plots, or transformations designed to stabilize changing variance.
This stage encourages you to ask practical questions. Did a new policy change the data-generating process? Is a missing month caused by a reporting problem? Does the scale grow as the level rises? Are later observations genuinely available at the time a forecast would have been made? These details can determine whether an analysis is credible.
You'll also become more familiar with reproducible workflows. Rather than editing values manually in a spreadsheet and hoping the result can be recreated, you may document cleaning steps in R, Python, or another statistical environment. That habit is useful in later coursework and in professional settings where another analyst must review or update your work.
Forecasting Models, Trends, And Seasonality
Forecasting is usually the technical center of a time series practicum. You may start with simple benchmarks such as a mean, naïve forecast, seasonal naïve forecast, or moving average. These methods can look unsophisticated, but they provide essential comparisons. A complicated model is not useful if it cannot outperform a reasonable baseline.
You'll likely study how trend describes persistent upward or downward movement and how seasonality represents a repeating pattern tied to a calendar or operating cycle. A school, for example, may have predictable enrollment changes throughout the year: an online retailer may experience holiday demand. A series can contain both components, along with cycles that do not repeat on a fixed schedule.
Common methods include exponential smoothing, regression-based forecasting, and ARIMA-style models. You may learn about stationarity, differencing, lagged values, residuals, and autocorrelation. You could also compare models with external predictors, such as weather, prices, holidays, or promotional activity. The practical challenge is balancing flexibility with overfitting: a model that explains the past extremely well may perform poorly on future observations.
Modern courses may introduce automated modeling or machine-learning approaches as well. But, the most useful lesson remains methodological rather than fashionable. You should be able to explain why a model fits the question, what information it uses, and what limitations remain.
Model Evaluation, Interpretation, And Communication
A forecast must be evaluated on data that were not used to train the model. Because time has an order, you generally cannot shuffle observations randomly as you might in some other predictive tasks. Instead, you may use a holdout period, rolling-origin evaluation, or another time-aware validation strategy.
You'll compare forecasts using measures such as mean absolute error, root mean squared error, or mean absolute percentage error, while recognizing that each metric emphasizes different kinds of mistakes. A model's numerical score is only part of the assessment. You should inspect residuals for patterns that suggest missing information, changing variance, or dependence left unexplained.
Interpretation matters just as much. You may need to explain a forecast interval, discuss the consequences of an unusually large error, or identify the assumptions behind a scenario. A strong report uses clear charts and plain language instead of hiding behind technical vocabulary. Your audience might be a supervisor, client, policymaker, or scholarship committee, not another time series specialist.
By the end, you should be more comfortable defending an analytical decision. That includes acknowledging uncertainty, describing data limitations, and recommending what should happen next.
What Type Of Student Does Well In STAT 854?
What type of student does well in STAT 854: Practicum in Time Series Analysis? You don't need to be the person who solves every equation instantly. You do need patience, curiosity, and a willingness to investigate why a result looks the way it does.
Students who thrive in the course tend to enjoy asking follow-up questions. If a forecast seems surprisingly accurate, they want to know whether it relied on information that would actually have been available at the time. If a model performs poorly, they look for a data issue, structural change, or inappropriate assumption instead of simply blaming the software.
Persistence is especially important. Time series projects rarely work perfectly on the first attempt. A date variable may be misread, a model may fail to converge, or a chart may reveal that the original question was too broad. You'll need to revise your approach without treating revision as failure.
Clear communication is another advantage. The strongest students can move between technical detail and practical meaning. You may be asked to explain an analytical choice to a reader who understands the problem but not the mathematics. Listening carefully, documenting your work, and checking your conclusions are just as valuable as speed with calculations.
Expected Prerequisites, Workload, And Technical Skills
Because STAT 854 appears to be an advanced course designation, you should expect prerequisites in statistics, probability, regression, or mathematical methods. Some programs may require an introductory time series course first. Others may admit students with equivalent preparation in economics, engineering, data science, or applied mathematics. Check the official course description rather than assuming the number "854" means the same thing at every school.
You'll probably need comfort with statistical inference, linear models, matrices, and basic calculus. Programming experience is often important because practical analysis involves importing data, creating visualizations, fitting models, and comparing results. R and Python are common, although a course may use specialized software. Spreadsheet skills can help with quick exploration, but they usually won't replace a reproducible coding workflow.
The workload may include readings, problem sets, coding exercises, quizzes, and one or more substantial projects. Budget time for debugging and interpretation, not only for running commands. A model can take seconds to fit while the reasoning around data quality and validation takes several hours.
If you're still in high school or early college, you can prepare by taking algebra, statistics, and programming seriously. Practice explaining graphs in words. Build a small project using publicly available monthly or daily data. Those habits can make advanced coursework less intimidating and help you decide whether this field deserves further study.
Projects, Assessments, And Practical Course Experience
A practicum usually evaluates how well you apply ideas, not just whether you can reproduce a formula on an exam. Assignments may ask you to analyze a real dataset, compare competing forecasts, diagnose residuals, or write a recommendation based on projected outcomes.
A larger project might follow a structure similar to professional consulting work. You could define a question such as forecasting monthly demand, assemble and clean the data, create exploratory graphics, establish a baseline, fit several candidate models, and evaluate them using a time-aware test period. The final deliverable might include a written report, presentation, dashboard, or code repository.
Strong project work begins with a narrow question. "Predict the economy" is too broad to be useful: "Forecast next quarter's monthly electricity demand for this service area" gives you a measurable target and a defined horizon. You'll also learn that the best model is not automatically the most complex one. A transparent seasonal method may be easier to maintain and just as accurate as a more elaborate alternative.
Expect assessment to include judgment. Instructors may grade whether your validation design is appropriate, whether your conclusions match your evidence, and whether another person could reproduce your analysis. Group projects, peer reviews, or presentations may also test collaboration and professional communication, the skills employers frequently expect from entry-level analysts.
Career Paths And Further Study After Time Series Analysis
Time series analysis can support several career directions. You might pursue work as a data analyst, statistician, forecasting analyst, business intelligence analyst, econometrician, operations researcher, or data scientist. Industries range from banking and insurance to retail, logistics, government, healthcare, manufacturing, and climate research.
The course is particularly useful if you enjoy questions involving planning and uncertainty. Employers may value your ability to estimate demand, monitor performance, detect unusual behavior, and communicate what the data does, and does not, support. Pairing time series skills with a domain such as public health, finance, computer science, or environmental studies can make your preparation more distinctive.
For further study, the course may strengthen applications to master's programs in statistics, data science, economics, applied mathematics, public policy, or engineering. It can also provide a practical project to discuss in applications and interviews. Keep a polished version of your report, code, visualizations, and a short explanation of the decisions you made.
Financial planning matters alongside academic planning. Advanced courses, technology costs, and graduate study can add up, so search early for grants, institutional aid, internships, and scholarships. Studentscholarships.org offers a free way to explore scholarship opportunities and career information in one place. Your time series coursework may open doors, but funding can determine how easily you're able to walk through them.
STAT 854: Practicum in Time Series Analysis - Frequently Asked Questions
What is the main focus of STAT 854: Practicum in Time Series Analysis?
STAT 854 emphasizes practical skills in analyzing time series data, teaching students how to identify patterns, choose appropriate forecasting methods, assess reliability, and communicate results beyond theoretical equations.
How does STAT 854 prepare students for real-world time series problems?
The course guides students through analyzing real sequential data—like sales or temperature—starting from messy datasets to forecasting and presentation, helping them tackle workplace challenges in industries like finance, public health, and energy.
What are common forecasting methods covered in STAT 854?
Students learn techniques such as moving averages, exponential smoothing, ARIMA models, regression with time predictors, and may explore automated or machine learning approaches, balancing model complexity with practical utility.
What skills are important to succeed in STAT 854?
Success requires patience, curiosity, persistence in troubleshooting analysis issues, and clear communication to explain technical choices and uncertainties to non-specialist audiences.
What prerequisites and technical skills should I have before enrolling in STAT 854?
You should have a background in statistics, probability, regression, and mathematical methods, along with programming experience—commonly in R or Python—to handle data cleaning, visualization, modeling, and evaluation.
How can time series analysis skills from STAT 854 benefit my career?
Mastering time series analysis opens career paths in data science, forecasting, econometrics, and business intelligence across sectors like banking, healthcare, and manufacturing, enhancing your ability to support data-driven planning and decision-making.